Before I get down to explaining the images of the “super” full moon rising that accompany this story, let me point you (in case you may be interested) to a few recent stories that feature me:
- Harold Davis becomes a Moab Master (story on the Moab blog)
- Tips from a Pro: Harold Davis on Getting Better Flower Photos (interview on PopPhoto.com)
- Book Review of Photographing Flowers (on PhotoFidelity—I particularly like the way this reviewer shows how my book helped his own photography)

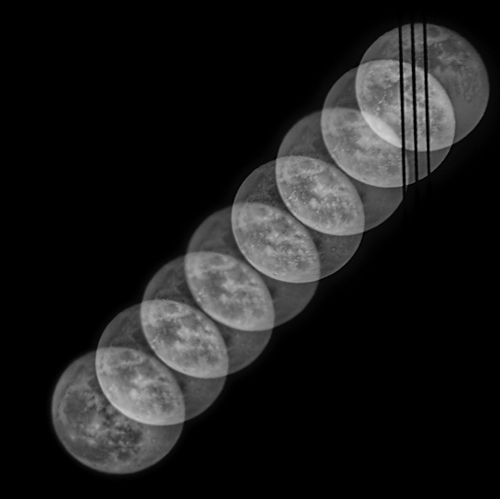
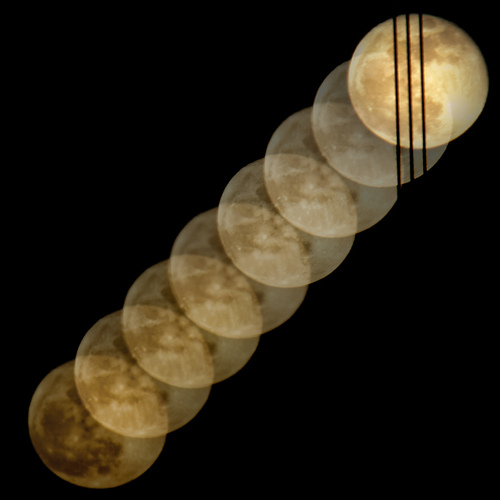
I shot this image during a recent Golden Gate Bridge and Full Moon workshop I gave. The moon was rising behind the Golden Gate Bridge from Battery Spencer in the Marin Headlands.
I used my intervalometer (remote programmable timer) to make 333 exposures while I went around to the people in the workshop to see how they were doing. So the camera shot this image on autopilot—and I didn’t have to do anything!
Each exposure was for 2 seconds at f/22 and ISO 100, using a 400mm focal length on my 1.5X crop Nikon D300 (effective 35mm focal length of 600mm). There was a one second interval between each of the exposures.
I started the sequence of exposures with the moon on the lower left of the frame because I knew the moon would move diagonally up, and I wanted it to stay in the frame as long as possible. The camera was unattended, so I had no way to know during the exposure sequence how well this was working.
When I looked at the captures on my computer, the moon started to leave the frame at the 170th exposure, so I had 169 exposures to work with if I wanted to keep the moon within the frame.
I used the Statistics script in Photoshop Extended to stack the 169 exposures. Stacking all the images together yielded a fat, blurred line: proving once again that sometimes it is possible to have too much information!
I found (by trial and error) that stacking every 25th exposure (for a total of eight exposures) gave interesting results in which you can see some detail in the moon.
The partial transparency in the final images was achieved by combining a stack created in Maximum mode in the Statistics script with a stack created using Mean mode in the Statistics script, each stack containing just the eight images.
The lines on the right are, of course, Golden Gate Bridge cables.
I should add that this makes a very cool print in either the black & white or color version, sized small, on Moab’s Moenkopi Kozo Washi rice paper.

Pingback: San Francisco and all that Jazz!